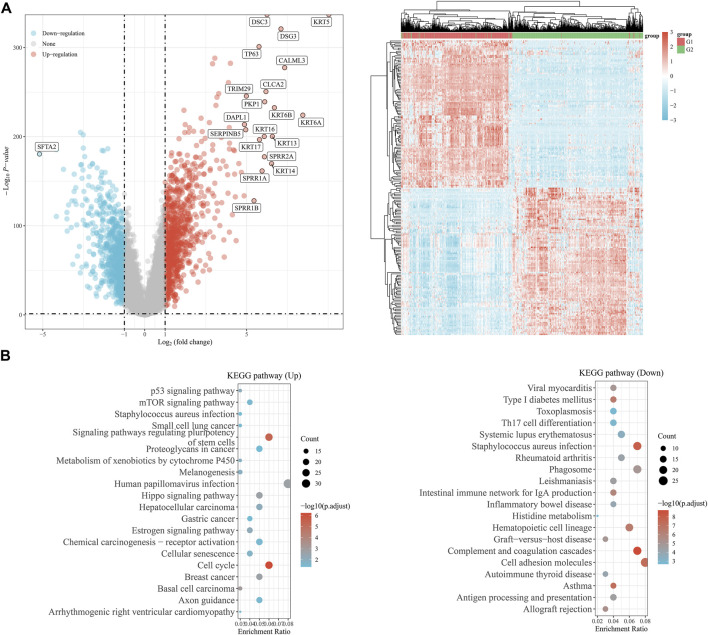
FIGURE 4.
Function enrichment analysis of EMT clusters and the identification of tumor-suppressor SFTA2. (A) The graphs show the differentially expressed genes in the C1 and C2 groups, with up-regulated genes in red and down-regulated genes in blue. (B) We performed functional enrichment analysis to show the pathways involved in differentially up-regulated and down-regulated genes in the KEGG database.

