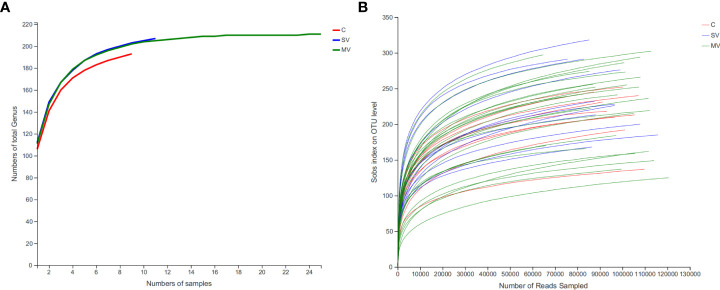
Figure 1.
Coverage of members in the gut microbiota of each group subject. (A) Rarefaction curves of detected gut microbiota genus of patient in each group reach the saturation stage with increasing numbers of samples, indicating that the gut microbiota in our population capture most gut microbiota members of human. (B) Rarefaction curves of detected bacterial OTUs of the gut microbiota from each group subject reach saturation stage with increasing sequencing depth.

