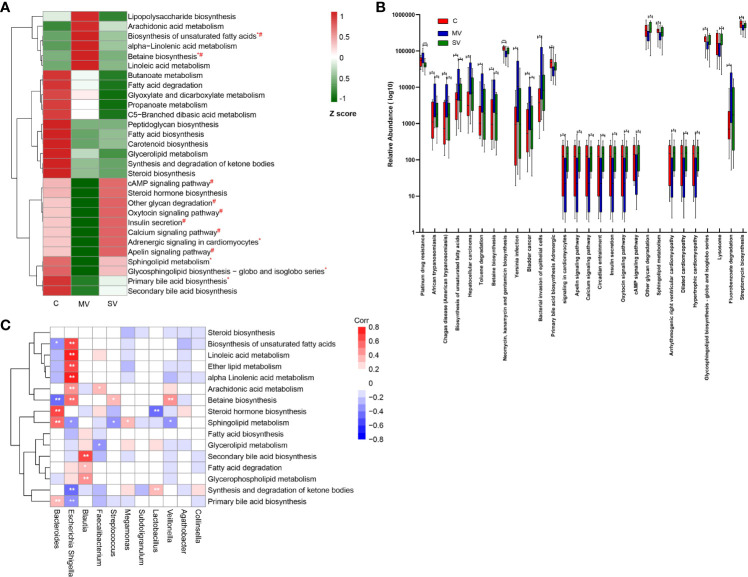
Figure 6.
Changes in gut microbiome function in CHD patients. (A) Relative abundance of part of bacterial metabolic pathways in different groups. The abundance profiles were transformed into Z scores by substracting the average abundances and dividing the standard deviations of all the samples. The Z score was negative (shown in green) when the row abundance was lower than the mean. Statistical analysis of metabolic pathways was performed using the Kruskal-Wallis test. *P<0.05 for equality between C vs MV: #P<0.05 for equality between MV vs SV. (B) The box plot shows that metabolism pathway (KEGG pathway level 3) significantly changed between different groups by Kruskal-Wallis test. *, Kruskal-Wallis test P-values<0.05; **, Kruskal-Wallis test P-values<0.01, boxes represent the inter-quartile ranges, and lines inside the boxes denote medians. (C) Spearman correlations between gut microbiota genera and functions. The colour represents positive (red) or negative (blue) correlations, and FDRs are denoted as follows: *FDR < 0.05, **FDR < 0.01.

