FIGURE 1.
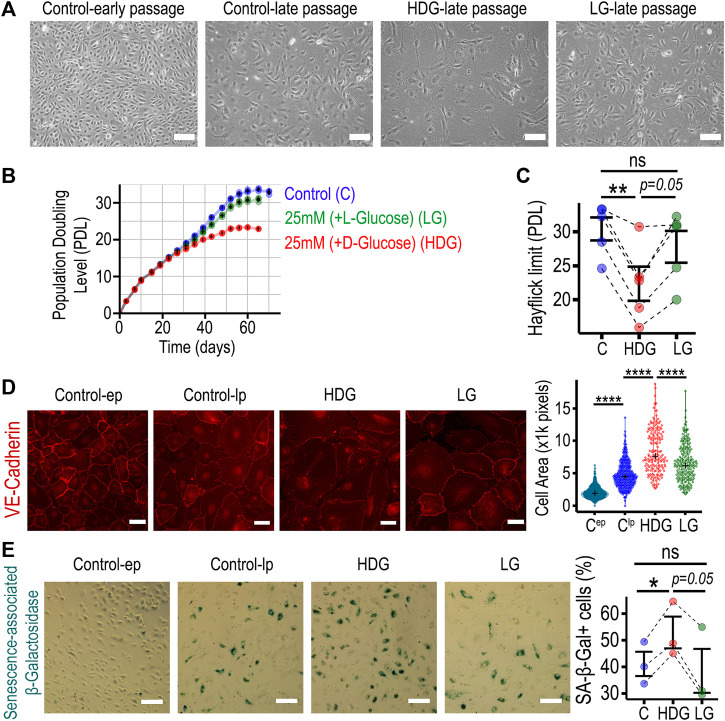
HRMECs undergo premature cellular senescence when cultured long term with 25 mM D-Glucose. (A) Phase-contrast 10X microscopy images of HRMECs at early passage (P4-P5), late passage (P11-P16), and experimental groups of late passage HRMECs treated with high glucose conditions (HDG or LG). Scale bar: 150 µm. (B) Growth curves for three experimental groups: control group cultured under 5 mM D-glucose, osmotic control topped up to 25 mM with l-glucose, and high glucose with 25 mM D-glucose. HRMECs were counted after every passage with automated CASY cell counter, cumulative population doublings calculated and plotted against time in culture. (C) For maximal cell number expansion, population doubling level reached at the Hayflick limit was used for statistical comparison. (D) Representative 20X images of VE-cadherin immunostaining in HRMECs after 4 weeks in culture to evaluate cell surface area using ImageJ. Scale bar: 50 µm (E) Representative 10X phase-contrast images of senescence-associated β-Galactosidase staining in HRMECs after 4 weeks in culture to identify and quantify senescent endothelial cells. Scale bar: 150 µm. *p < 0.05, **p < 0.01, ****p < 0.0001, ns: not significant. One-way ANOVA, with Tukey’s post-hoc analysis was used. PDL, Population doubling level; C, control (5 mM D-Glucose); LG, 25 mM (+L-glucose); HDG, 25 mM (+D-glucose); ep, early passage; lp, late passage.

