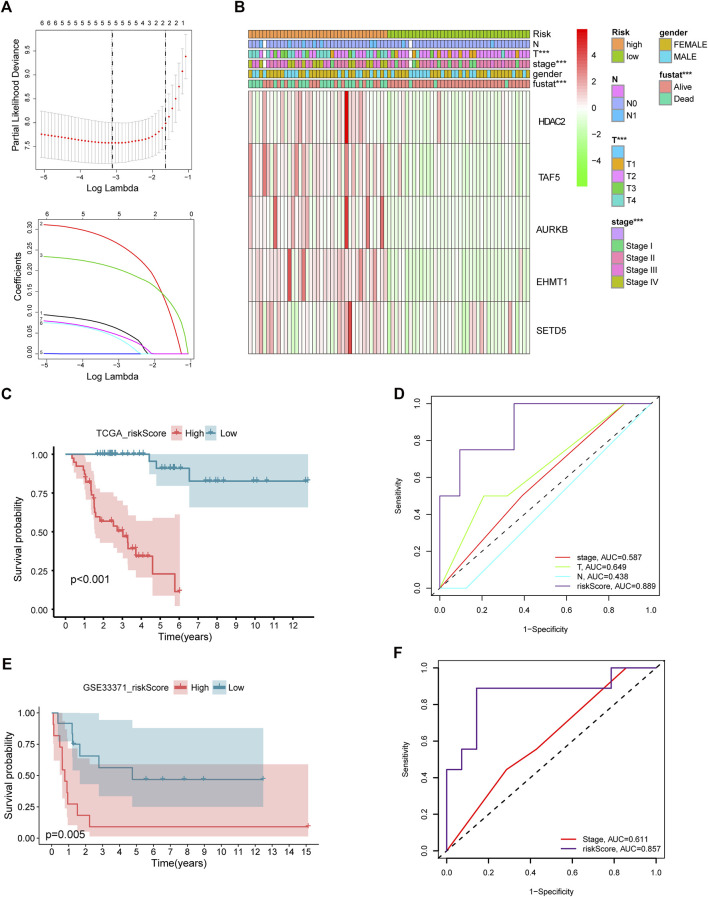
FIGURE 2.
Lasso Cox regression of DECRs (A). Expression of five selected DECRs in different clinical features groups (B). KM survival analysis of low- and high-risk patients in test cohort (C). ROC analysis of clinical stage, clinical T stage, clinical N stage and riskscore in test cohort (D). KM survival analysis of low- and high-risk patients in validation cohort (E). ROC analysis of stage and riskscore in validation cohort (F).

