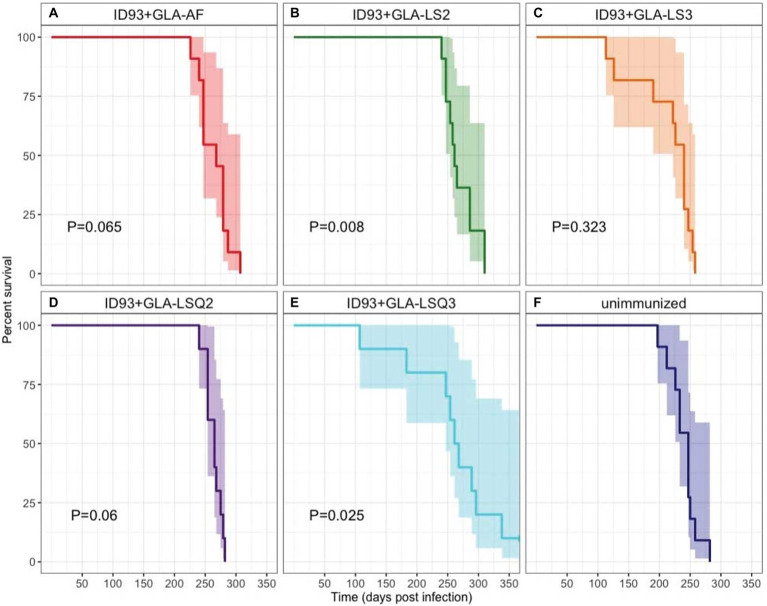
Figure 6.
Kaplan–Meier survival curves for each intervention. A subset of 11 mice per group were followed for survival following Mtb H37Rv infection, treatment for 8 weeks with Isoniazid, Rifampin, and Pyrazinamide in the drinking water, and therapeutic immunization with ID93 vaccines 4 weeks after the start of drug treatment. 95% CI is indicated in the shaded region on each side of the Kaplan–Meier survival curve. Indicated p values were determined using Cox Proportional Hazard models and are relative to the unimmunized group. N = 11 mice per group, except for ID93 + GLA-LSQ2 and ID93 + GLA-LSQ3 (n = 9 mice/group); (A) Drug treatment + ID93 + GLA-AF; (B) Drug treatment + ID93 + GLA-LS2; (C) Drug treatment + ID93 + GLA-LS3; (D) Drug treatment + ID93 + GLA-LSQ2; (E) Drug treatment + ID93 + GLA-LSQ3; and (F) Drug treatment only (unimmunized).

