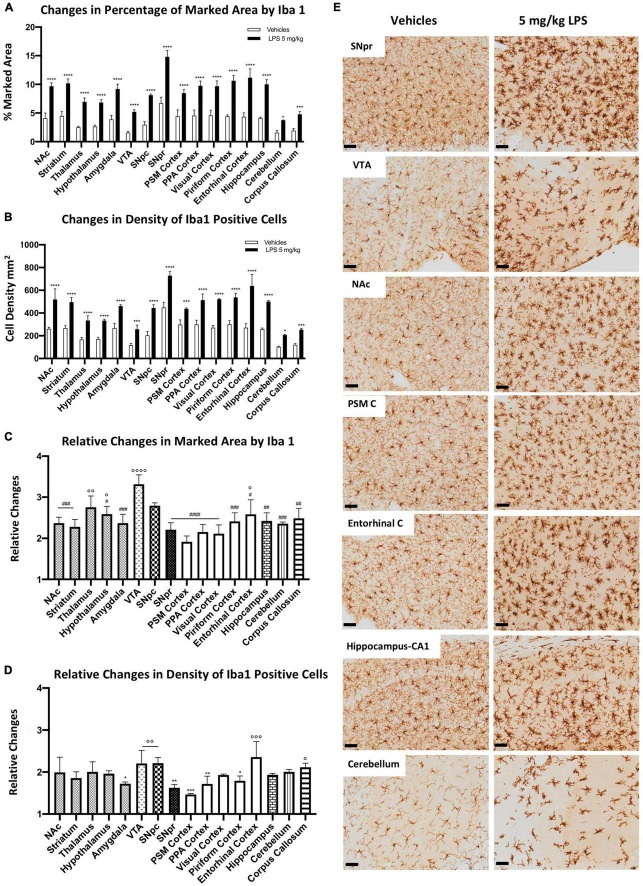
FIGURE 2.
Heterogeneous microglial alterations 24 h after 5 mg/kg LPS administration. (A) Percentage of the marked area by Iba1 in vehicles (white columns) and LPS treated mice (black columns). Two-way ANOVA FBrain Regions (15, 64) = 46.13, p < 0.0001. FTreatment (1, 64) = 1127, p < 0.0001. FInteraction (15, 64) = 6.081, p < 0.0001, and n = 3 mice per region. Significance: (*) respect relative vehicles. (B) Iba 1 positive cell density per mm2 in vehicles (white columns) and LPS treated mice (black columns). Two-way ANOVA FBrain Regions (15, 64) = 56.84, p < 0.0001. FTreatment (15, 64) = 786.7, p < 0.0001. FInteraction (15, 64) = 5.138, p < 0.0001, and n = 3 mice per region. Significance: (*) respect relative vehicles. (C) Relative changes in the percentage of marked area by Iba1 between LPS and vehicle-treated mice. One-way ANOVA FBrain Regions (15, 32) = 7.453, p < 0.0001, and n = 3 mice per region. Significance: (#) respect VTA; (°) respect PSM cortex. Other significances are summarized in Supplementary Table 4A. (D) Relative changes in density of Iba1 positive cells between LPS and vehicle-treated mice. One-way ANOVA FBrain Regions (15, 32) = 4,890 p < 0.0001, and n = 3 mice per region. Significance: (*) respect the Entorhinal cortex; (°) respect the PSM cortex. Other significances are summarized in Supplementary Table 4B. (E) Representative images of Iba 1 staining in SNpr, VTA, NAc, PSM cortex, entorhinal cortex, hippocampus (CA1), and cerebellum. Scale bar = 50 um.

