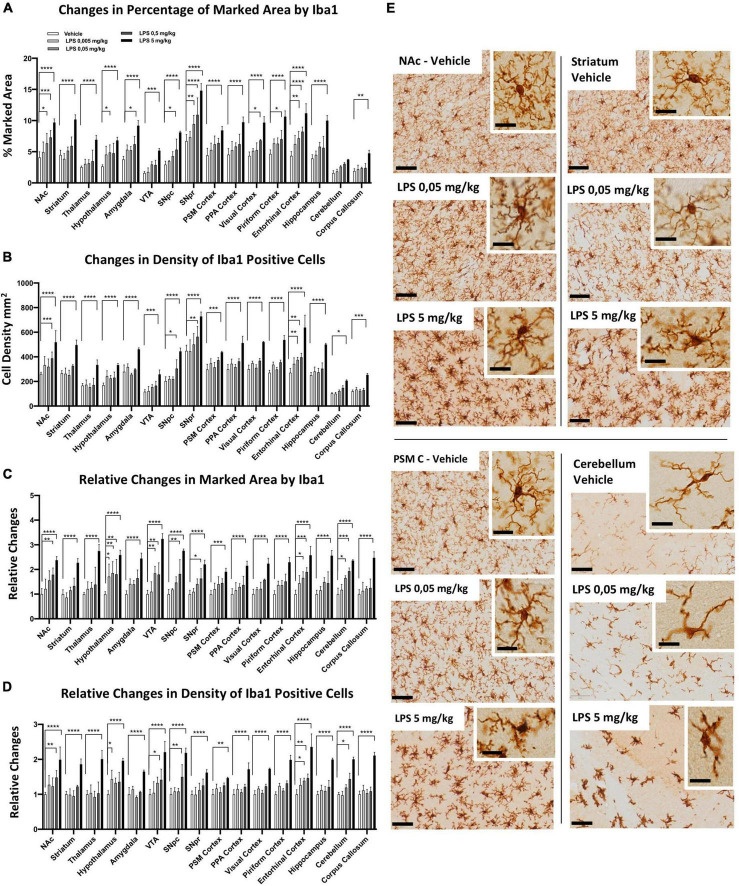
FIGURE 3.
Regional specific microglia activation to different doses of LPS in C57BL6 mice. (A) Percentage of marked area by Iba1 in vehicles (white columns), LPS treated mice with 0.005 mg/kg (clear gray columns), 0.05 mg/kg (medium gray columns), 0,5 mg/kg (dark gray columns), 5 mg/kg (black columns). Two-way ANOVA. FBrain Regions (15, 160) = 57.94, p < 0.0001. FTreatment (4, 160) = 188,3, p < 0.0001. FInteraction (60, 160) = 1.599, p < 0.0110, and n = 3 mice per region. Significance: respect relative vehicles. (B) Iba1 positive cell density mm2. Same column color as graph (A). Two-way ANOVA. FBrain Regions (15, 160) = 112.7, p < 0.0001. FTreatment (4, 160) = 222.1, p < 0.0001. FInteraction (60, 160) = 2.039, p < 0.0002, and n = 3 mice per region. Significance: (*) Significance: respect relative vehicles. (C) Relative changes in percentage of area marked by Iba1. Same column color as graph (A). Two-way. FBrain Regions (15, 160) = 4.169, p < 0.0001. FTreatment (4, 160) = 202.4, p < 0.0001. FInteraction (60, 160) = 1.259, p < 0.1304, and n = 3 mice per region. Significance: (*) respect relative vehicles. (D) Relative changes in Iba1 positive cell density. Same column color as graph (A). Two-way ANOVA. FBrain Regions (15, 160) = 5.660, p < 0.0001. FTreatment (4, 160) = 247.6, p < 0.0001. FInteraction (60, 160) = 1.848, p < 0.0013, and n = 3 mice per region. Significance: (*) respect relative vehicles. (E) Representative images of Iba 1 staining in Veh, 0.05 and 5 mg/kg LPS doses in NAc, striatum, PSM cortex and cerebellum. Scale bars = 50 um in (E) and 10 um insets.

