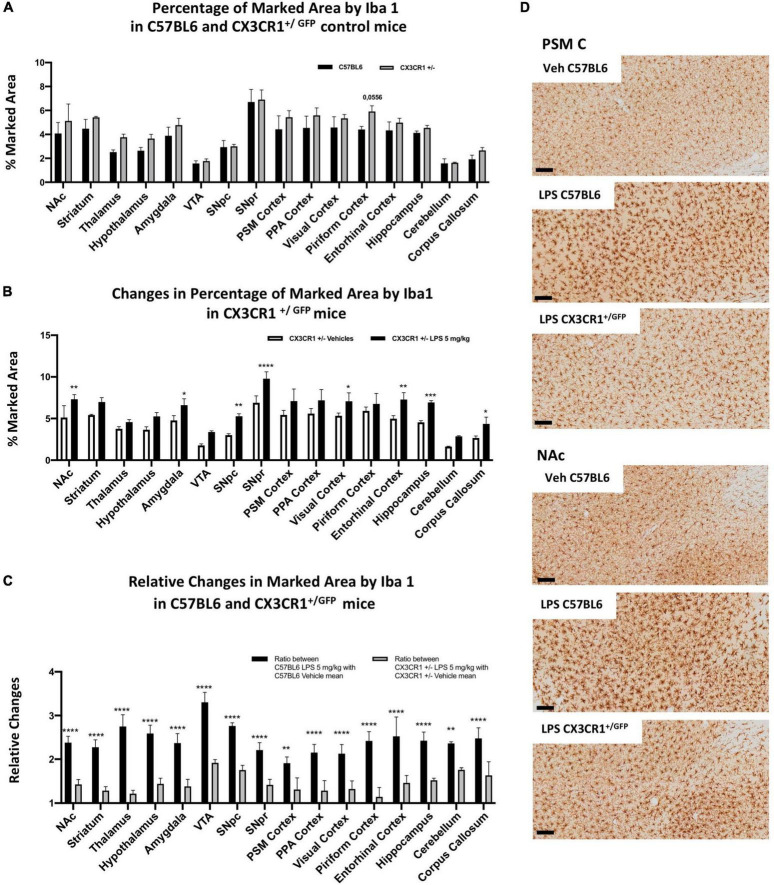
FIGURE 6.
Microglia heterogeneity in CX3CR1+/GFP mice. (A) Percentage of the marked area by Iba1 between C57BL6 (black column) and CX3CR1+/GFP mice (gray columns) in control conditions. Two-way ANOVA. FBrain Regions (15, 64) = 32.50, p < 0.0001. FGenotype (1, 64) = 36.68, p < 0.0001. FInteraction (15, 64) = 0.7510, p < 0.7241, and n = 3 mice per region. Significance: (*) respect same regions between two genotypes. (B) Percentage of the marked area by Iba1 positive cells in CX3CR1+/GFP mice. Vehicles (white columns) and LPS treated mice (black columns). Two-way ANOVA. FBrain Regions (15, 64) = 34.78, p < 0.0001. FTreatment (1, 64) = 164.9, p < 0.0001. FInteraction (15, 64) = 1.327, p < 0.2129, and n = 3 mice per region. Significance: (*) respect relative vehicles. (C) Relative changes in percentage of the marked area by Iba1 between LPS 5 mg/kg and vehicles mice 24 h after treatment in C57BL6 mice (black columns) and CX3CR1+/GFP mice (gray columns). Two-way ANOVA FBrain Regions (15, 64) = 10.13, p < 0.0001. FTreatment (1, 64) = 687.5, p < 0.0001. FInteraction (15, 64) = 2.862, p < 0.0018, and n = 3 mice per region. Significance: (*) respect relative vehicles. (D) Representative images of Iba1 staining in PSM cortex and NAc in C57BL6 and CX3CR1+/GFP mice treated with 5 mg/kg LPS or vehicles. Scale bar = 100 um.

