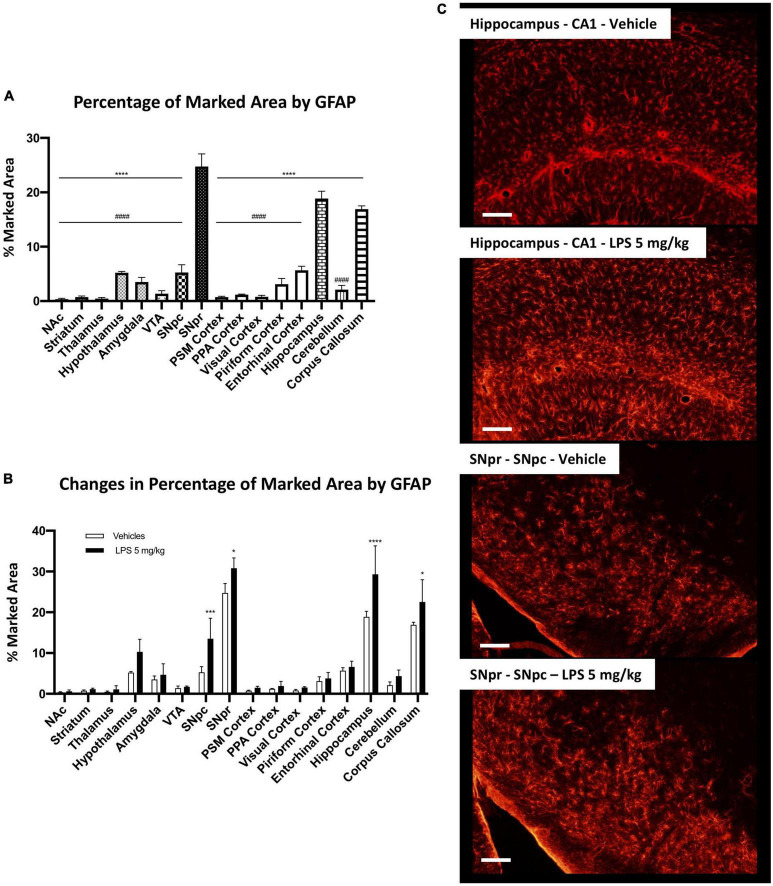
FIGURE 8.
Brain region-specific astrocyte distribution and activation induced by systemic LPS. (A) Percentage of the marked area by GFAP positive astrocytes in vehicles C57BL6N mice. One-way ANOVA FBrain Regions (15, 32) = 206.8, p < 0.0001, and n = 3 mice per region. Significance: (*) respect SNpr; (#) respect hippocampus and corpus callosum. Other significances are summarized in Supplementary Table 5. (B) Percentage of the marked area by GFAP positive cells in vehicles (white columns) and LPS treated mice (black columns). Two-way ANOVA FBrain Regions (15, 64) = 100.6, p < 0.0001. FTreatment (1, 64) = 39.24, p < 0.0001. FInteraction (15, 64) = 3.406, p < 0.0003, and n = 3 mice per region. Significance: (*) respect relative vehicles. (C) Representative images of GFAP positive astrocytes in hippocampus and SNpr in vehicles and LPS treated mice.

