FIGURE 9.
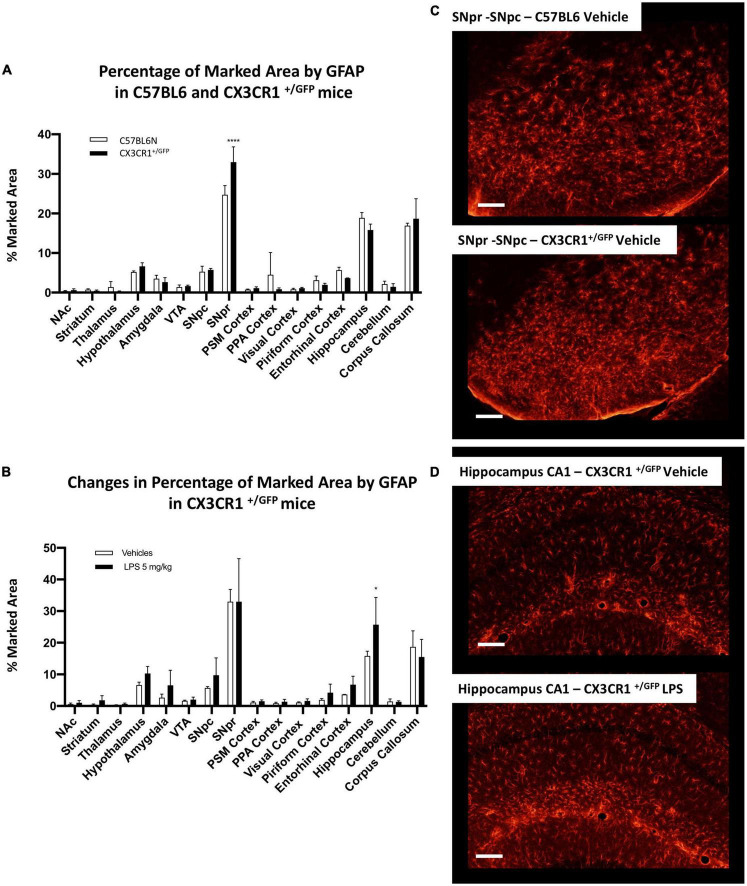
Astrocytes heterogeneity in CX3CR1+/GFP mice. (A) Percentage of marked area by GFAP positive astrocytes in vehicles C57BL6N and CX3CR1+/GFP mice. Two-way ANOVA FBrain Regions (15, 64) = 136.9, p < 0.0001. FGenotype (1, 64) = 0.00128, p < 0.9715. FInteraction (15, 64) = 3.575, p < 0.0002, and n = 3 mice per region. Significance: (*) respect relative regions in C57BL6 mice. (B) Changes in percentage of marked area by GFAP positive astrocytes in CX3CR1+/GFP mice cells in vehicles (white columns) and LPS treated (black columns). Two-way ANOVA. FBrain Regions (15, 64) = 39.36, p < 0.0001. FTreatment (1, 64) = 5.526, p < 0.0218. FInteraction (15, 64) = 0.9605, p < 0.5055, and n = 3 mice per region. Significance: (*) respect relative vehicles. (C) Confocal images of GFAP positive astrocytes in SNpr in C57BL6 and CX3CR1+/GFP mice. (D) Representative images of GFAP positive astrocytes in hippocampus of CX3CR1+/GFP mice treated with 5 mg/kg LPS and relative control.

