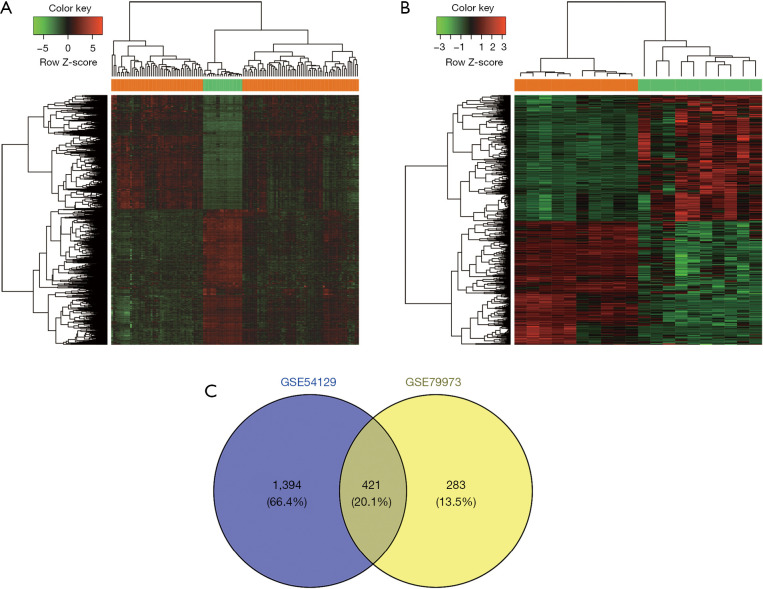
Figure 1.
Gene differential expression analysis. (A) Heatmap of the DEGs in the GSE54129 data set. (B) Heatmap of the DEGs in the GSE79973 data set. (C) The Venn diagram shows the intersection DEGs between the GSE54129 and GSE79973 data sets. The orange bars indicated the GC samples, and the green bars indicated the controls. GC, gastric cancer; DEGs, differentially expressed genes.

