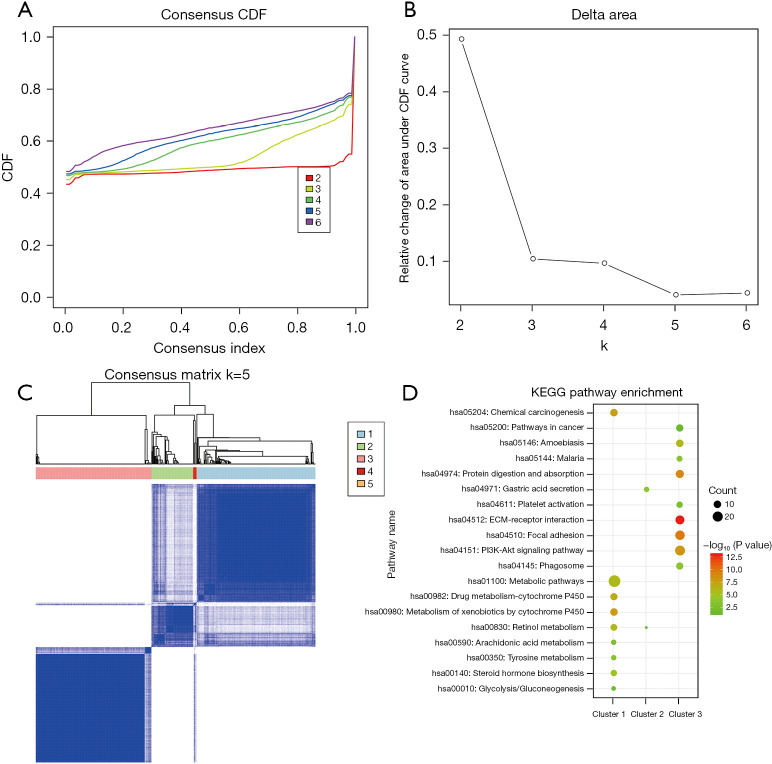
Figure 2.
Gene clustering and functional analyses. (A) The consensus CDF curve; (B) the CDF delta area curve, which represents the area difference between the area of CDF under ki and horizontal axis and CDF under ki + 1 and horizontal axis; (C) the consensus cluster under k=5; (D) The KEGG pathway enrichment analysis of genes in clusters 1–3. k represents the number of gene clusters. CDF, cumulative distribution function, KEGG, Kyoto Encyclopedia of Genes and Genomes.

