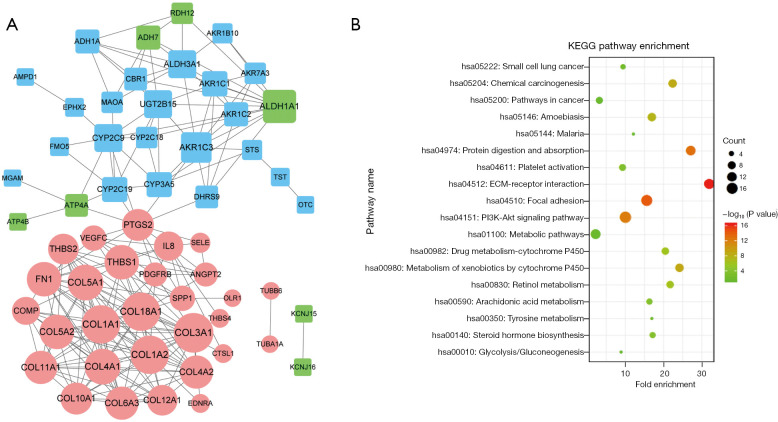
Figure 3.
PPI and functional analyses. (A) The PPI network. The circular nodes represent the upregulated genes, and the square nodes represent the downregulated genes. The blue nodes show the genes in cluster 1, the green nodes show the genes in cluster 2, and the pink nodes show the genes in cluster 3. The size of each node represents the degree value. (B) The KEGG pathway enrichment analysis of the hub genes in the PPI network. The hub genes were those with a degree ≥5. PPI, protein-protein interaction, KEGG, Kyoto Encyclopedia of Genes and Genomes.

