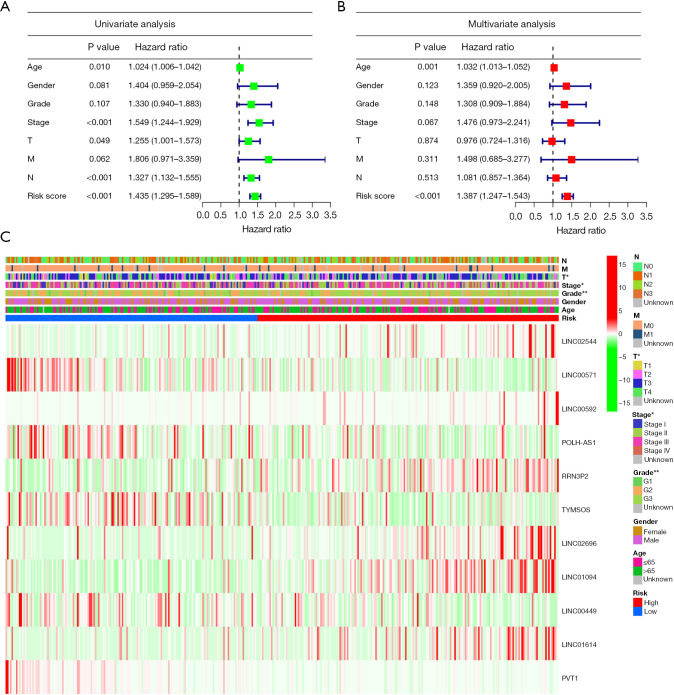
Figure 4.
Analysis of the correlation between various clinicopathological characteristics and prognostic variables in the TCGA cohort. (A,B) Risk score and other clinical parameters related to GC were investigated using the univariate and multivariate Cox regression analyses. (C) Heatmap for the clinical correlation. Green denotes a low-risk subtype, whereas red denotes a high-risk category. The main abscissa shows the high-risk group and low-risk group; we show the high-risk category in red and the low-risk subtype in blue. The tumor TNM stage, gender, age, survival time, OS status, and the clinicopathological stage are also included in the abscissa stratification; the ordinate shows the expression levels of distinctive prognostic lncRNAs linked to ferroptosis in all samples. *P<0.05; **P<0.01. TCGA, The Cancer Genome Atlas; GC, gastric cancer; TNM, tumor-node-metastasis; OS, overall survival; lncRNAs, long non-coding RNAs.

