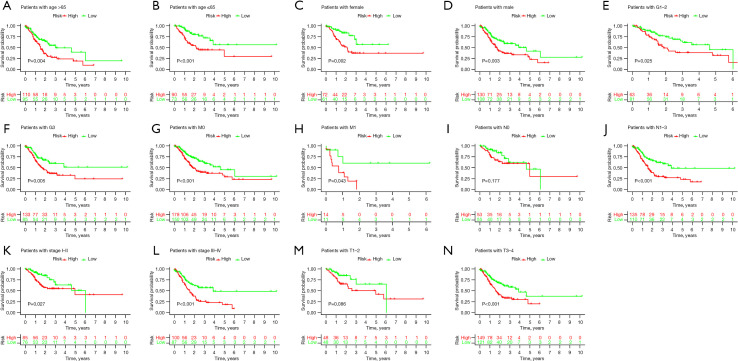
Figure 5.
KM analysis shows the OS status curves of the patients with GC in different subgroups. (A) Age >65; (B) age ≤65; (C) females; (D) males; (E) G1–G2; (F) G3; (G) M0; (H) M1; (I) N0; (J) N1–N3; (K) stage I + II; (L) stage III + IV; (M) T1–T2; (N) T3–T4. KM, Kaplan-Meier; OS, overall survival; GC, gastric cancer.

