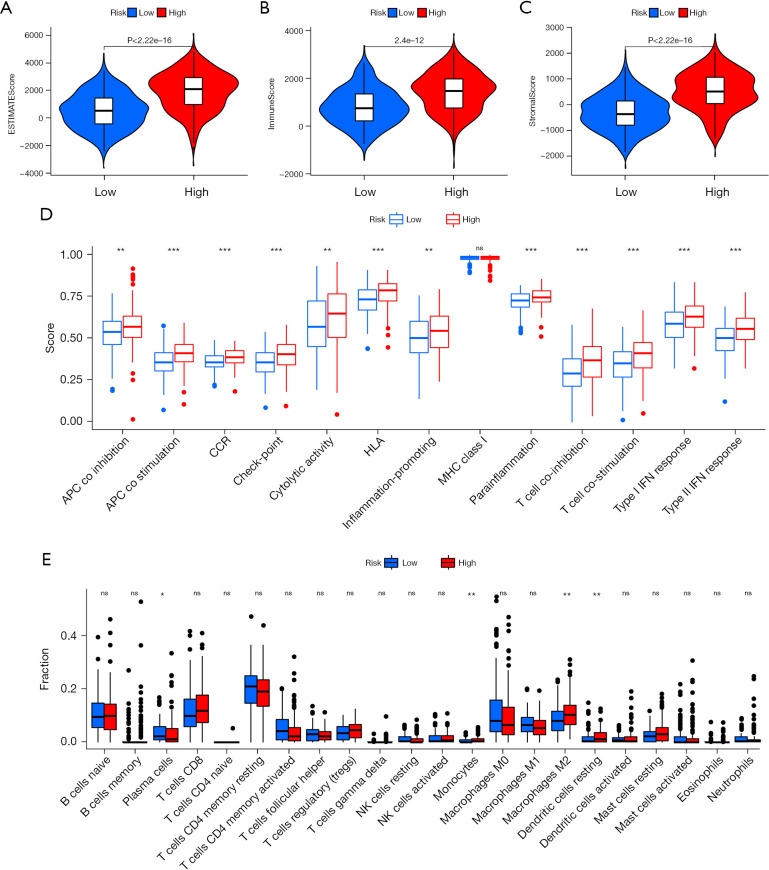
Figure 8.
Analysis of the infiltration landscape of the different immune cells in the GC patients. (A) Estimated, (B) immune, and (C) stromal scores for the GC patients in both the risk categories. (D) In the TCGA dataset, 13 immune-linked functions were compared between the 2 different risk groups. (E) Box plot for analyzing the 22 immune cells in the patients with colon cancer in both the risk groups. *P<0.05; **P<0.01; ***P<0.001; ns, not significant. GC, gastric cancer; TCGA, The Cancer Genome Atlas.

