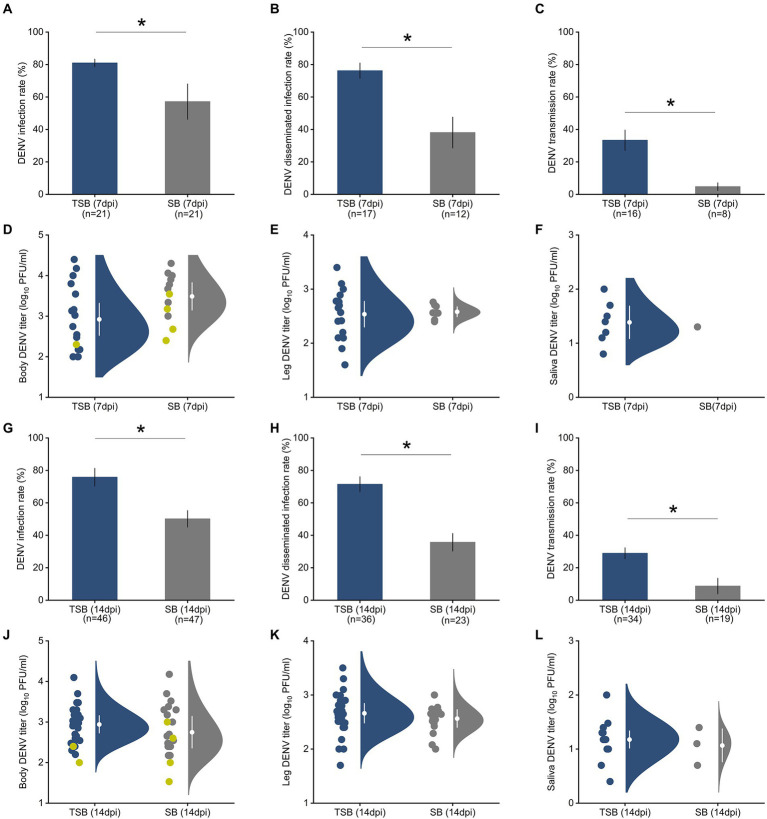
Figure 2.
Ingestion of TSB effects on Ae. albopictus susceptibility to DENV infection (A), disseminated infection (B), and transmission (C) rates at 7 dpi. The bars represent the means and standard error of means. Raincloud plots represent distributions of DENV titers as measured by plaque assay in mosquito tissues, body (D), legs (E), and saliva (F) at 7 dpi. Susceptibility to DENV infection (G), disseminated infection (H), and transmission (I) at 14 dpi. Raincloud plots represent distributions of DENV titers in mosquito tissues, body (J), legs (K), and saliva (L) at 14 dpi. Each circle indicates a data point for an individual DENV-infected female. Yellow circles in panels (D,J) represent viral titer in mosquito bodies with non-disseminated infection, and gray and navy blue circles represent mosquito bodies with disseminated infections. White circles and lines inside the rainclouds represent the means and standard error of means, respectively. The density distribution of data is indicated by the filled area. We observed a significant increase in susceptibility to DENV infection, disseminated infection, and transmission after TSB ingestion at both time points (7 and 14 dpi). However, DENV titers in mosquito tissues (body, legs, saliva) were not affected by TSB ingestion at the two time points. The significant effects of TSB ingestion on DENV infection measurements were determined by logistic regression analysis with post hoc pairwise comparison using the Tukey–Kramer test. The number of mosquitoes assayed is indicated below each bar. Asterisks (*) on the top of the bars represent p < 0.05.

