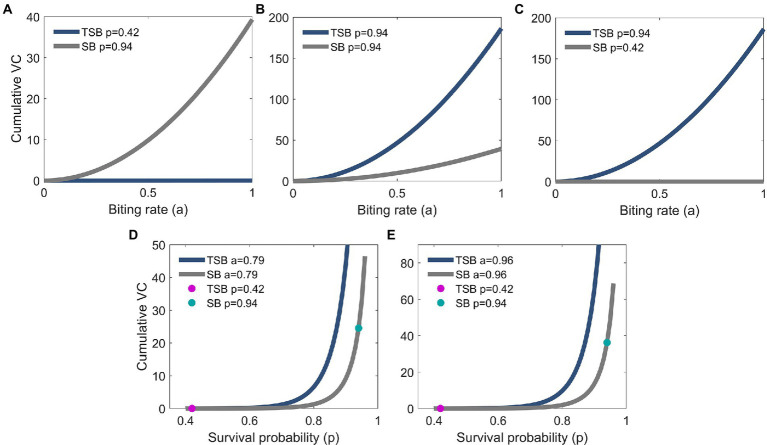
Figure 4.
Biting rate effect on cumulative vectorial capacity (cVC) of TSB-ingested mosquitoes (navy blue line) and of SB-ingested mosquitoes (control; gray line). cVC is higher for control mosquitoes for the empirically observed survival probabilities in our study (A), but the opposite is predicted assuming equal (B) or higher survival probabilities in the TSB-ingested mosquitoes (C). cVC is evaluated using Eq. (3) with mosquito density set at m = 10 and the empirically obtained values of vector competence. The values for cVC in (A) are on a different scale than in panels (B,C). Survival probability effect on cVC of TSB-ingested mosquitoes and control mosquitoes (D,E). Empirical results are shown in dots (magenta for TSB and green for SB). cVC is evaluated using Eq. (3) with mosquito density set at m = 10 and the empirically obtained values of vector competence. The values for cVC in (D) are on a different scale than in (E).

