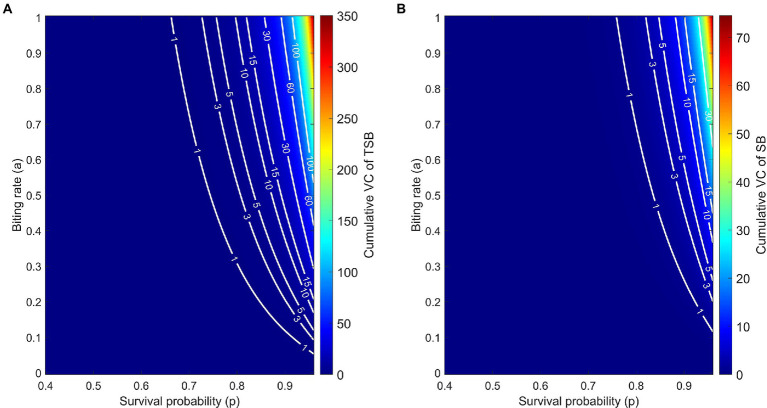
Figure 5.
Cumulative vectorial capacity (cVC) as a function of both the daily survival probability (horizontal axis) and the biting rate (vertical axis) of TSB-ingested mosquitoes (A) and SB-ingested mosquitoes (control) (B). Along the level curves (white curves) cVC assumes the annotated values, ranging from 0 to 350.1 for TSB-ingested mosquitoes and from 0 to 74.55 for control mosquitoes. cVC is evaluated using Eq. (3) with mosquito density set at m = 10 and the empirically obtained values of vector competence.

