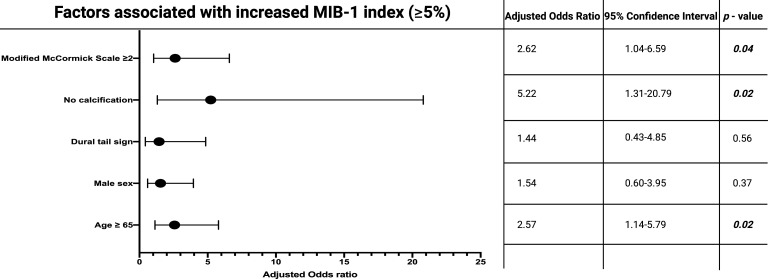
Figure 3.
Forest plots from multivariable binary logistic regression analysis: Modified McCormick scale ≥ 2 at presentation, age ≥ 65 years at diagnosis, and absence of calcification are independent predictors of increased MIB-1 labeling index. Black circles indicate the adjusted odds ratio of each variable and the lines represent the corresponding 95% confidence interval. P-values in bold and italics display statistically significant results.

