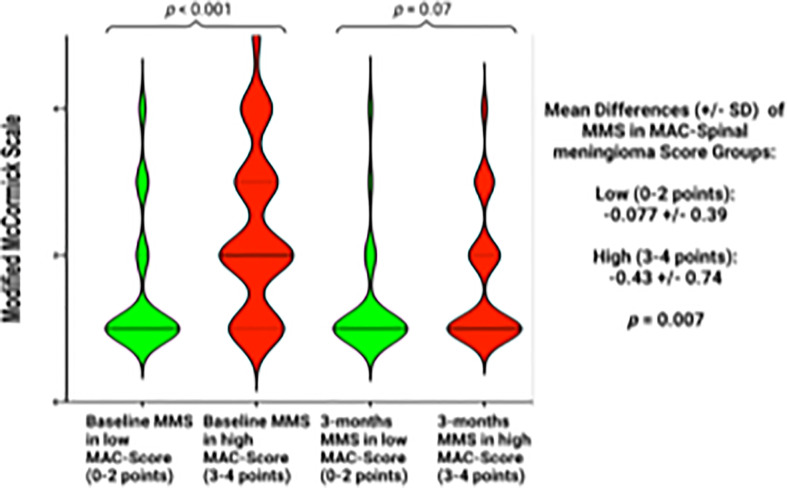
Figure 7.
Violin plots displaying the Modified McCormick scale at the preoperative examination, and at 3-months after surgery in patients with a low MAC-Spinal Meningioma score (0-2 points, green violin plot) or a high MAC-Spinal Meningioma score (3-4 points, red violin plot). Violin plots show mean and distribution of Modified McCormick scale. The thick horizontal black lines are the median values. P-values of the Student´s t-test are reported.

