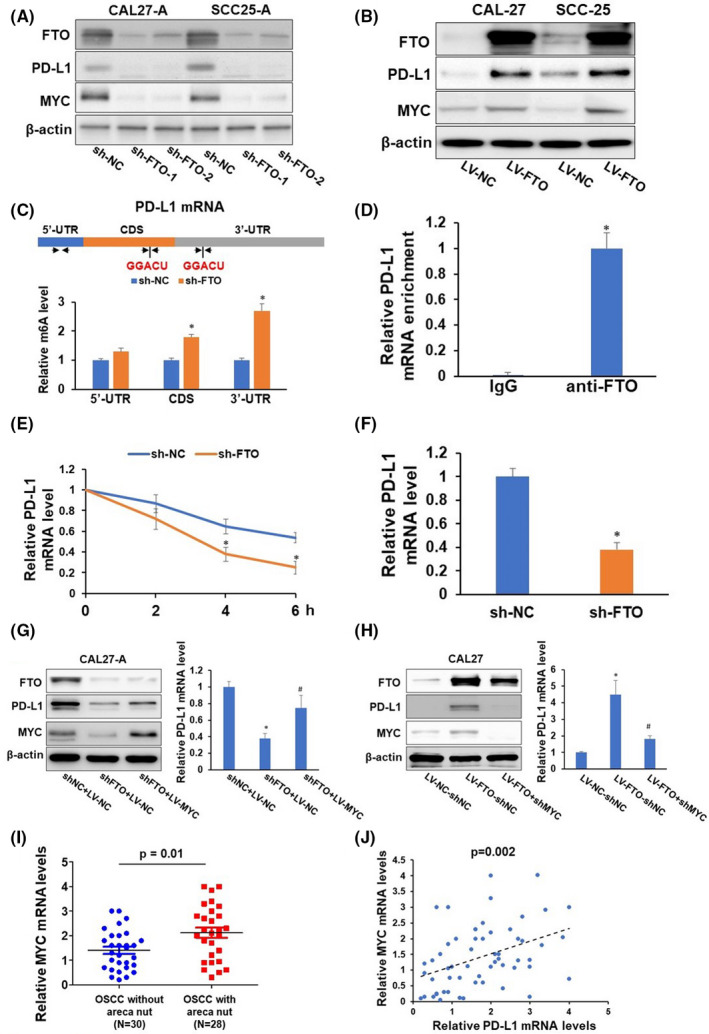
FIGURE 3.

Fat mass and obesity‐associated protein (FTO) regulates programmed cell death‐ligand 1 (PD‐L1) via m6A modification and MYC‐mediated transcription. (A–B) CAL27‐A and SCC25‐A were infected with lentivirus carrying sh‐nonsense control (NC), sh‐FTO‐1, or sh‐FTO‐2 (A). CAL27 and SCC25 were infected with lentivirus carrying nonsense control (NC or FTO. The expression levels of FTO, PD‐L1, MYC, and β‐actin in these cells were determined by western blotting. (C) Two consensus m6A modification sites (GGACU) and three sets of quantitative (qPCR) primers are depicted in the 5′‐UTR, CDS, and 3′‐UTR regions of PD‐L1 mRNA. Methylated RNA in CAL‐27‐A cells with or without FTO knockdown was immunoprecipitated with the m6A antibody, followed by qPCR analyses with three sets of indicated primers. (D) RNA immunoprecipitation analyses of CAL27‐A cells were performed with an anti‐FTO antibody followed by qPCR analyses of PD‐L1 mRNA. (E–F) qPCR analyses of PD‐L1 mRNA stability (E) and mRNA level (F) in CAL‐27‐A cells with or without FTO knockdown. (G–H) CAL27‐A‐shNC cells or CAL27‐A‐shFTO cells were infected with indicated lentiviruses. The expression levels of FTO, PD‐L1, MYC, and β‐actin in these cells were determined by western blotting. The mRNA levels of PD‐L1 were assessed by RT‐qPCR. (I) The expression levels of MYC in oral squamous cell carcinoma (OSCC) without areca nut (n = 30), and OSCC with areca nut (n = 28) were determined by RT‐qPCR assay. (J) The correlation of MYC and PD‐L1 in 58 OSCC patients was analyzed by Pearson correlation analysis. *P < 0.05
