
FIGURE 2.
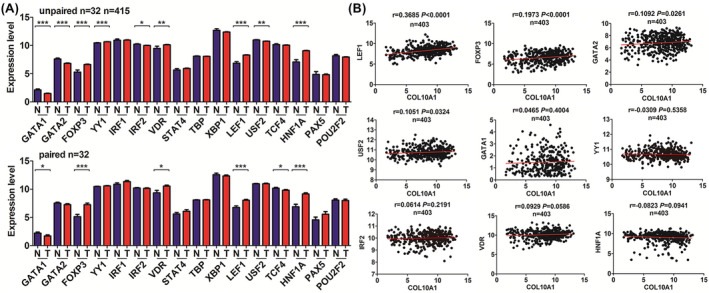
Expression pattern of transcription factors (TFs) and their correlations with COL10A1 expression in GC. (A) The expression levels of TFs in the GC samples compared with adjacent normal ones. (B) Pearson's correlation between the expression of COL10A1 and differential expressed TFs in GC.