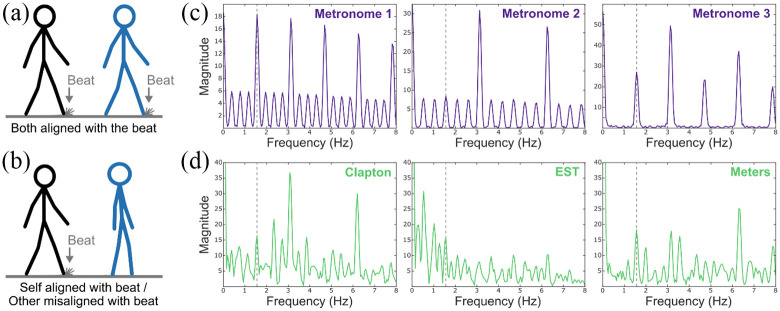
Figure 4.
(a and b) The Two Different Movement Alignment Levels of the Social Entrainment Video Paradigm in Study 2. (c and d) Frequency Spectra of the Note-Onset Interval Series of the Three Metronome Stimuli (c) and the Three Music Stimuli (d) Detected by mironsets in the MIR Toolbox (Lartillot & Toiviainen, 2007) for MATLAB (MathWorks, Natick, MA). The Dashed Gray Line Represents the Beat of the Audio Stimuli and the Temporally Aligned Step Frequency of the Visual Stimuli, Which Was 94 bpm/638 ms.

