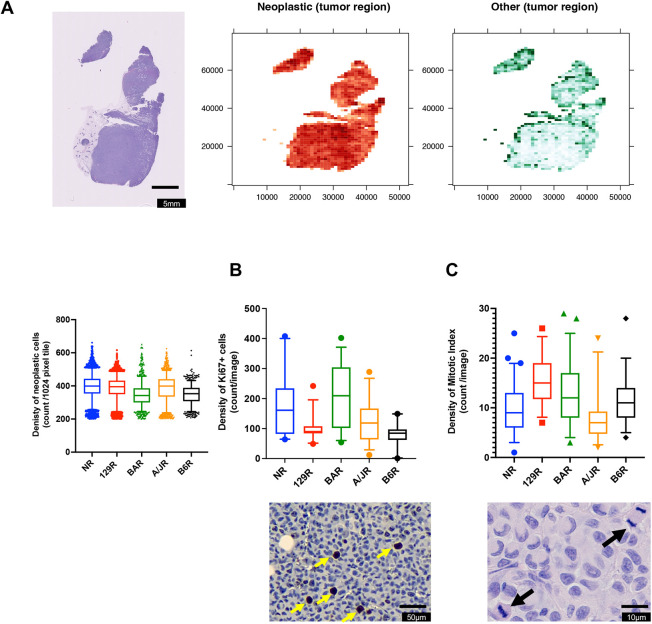
Fig. 3.
Tumor cell content from whole-slide images of Rag1−/− strains. (A) Representative H&E image (left), spatial distribution of neoplastic nuclei density (center), and spatial distribution of all other nuclei types combined (connective, inflammatory, non-neoplastic epithelial, dead and non-labeled; right) for each strain. The nuclei density is defined as the number of nuclei per 1024×1024 pixel tile. The heatmaps are restricted to tumor regions with >200 neoplastic nuclei per tile. In the box and whisker plot below, boxes show 5-95% confidence interval with the median, whiskers indicate 95% confidence interval (849-3506 images from three biological replicates from each strain). (B) Representative image of Ki67 staining (yellow arrows indicate a positive cell) with the box and whisker plot (boxes show 5-95% confidence interval with the median, whiskers indicate 95% confidence interval; 18-30 images from three biological replicates from each strain) for density of Ki67-positive cells. (C) Representative image of mitotic cells (black arrows) with the box and whisker plot (boxes show 5-95% confidence interval with the median, whiskers indicate 95% confidence interval; 30-60 images from three to six biological replicates from each strain) for density of mitotic index. P-values by nested one-way ANOVA accounting for multiple measurements per tumor. The statistical differences found comparing the strains are indicated in the text.

