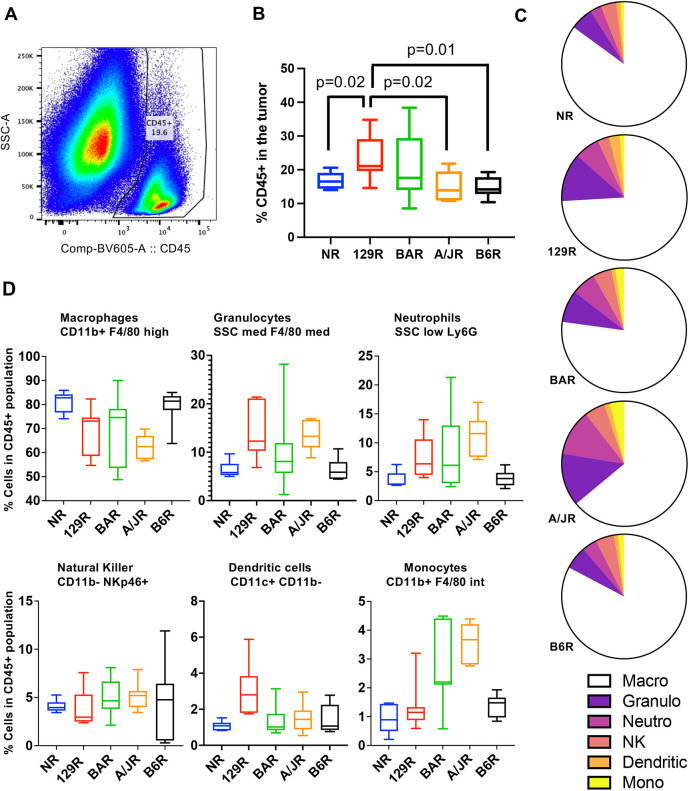
Fig. 4.
Tumor-infiltrating myeloid cells positively correlate with tumor size. (A) Representative flow cytometer gating used to detect CD45+ cells (white blood cells) in the tumor. (B) Proportion of CD45+ cells in the tumor in Rag1−/− mice of different strains. Box and whisker plot (boxes show 5-95% confidence interval with the median, whiskers indicate 95% confidence interval; N=7 biological replicates from each strain) showing the percentage of CD45+ cells in the tumor. Only pairwise statistically significant values are shown. (C) Pie charts showing cell type distribution with the CD45+ population. Macro, macrophages; Granulo, granulocytes; Neutro, neutrophils; NK, natural killer cells; Dendritic, dendritic cells; Mono, monocytes. (D) Distribution of different myeloid populations within the CD45+ pool from each strain. Boxes show 5-95% confidence interval with the median, whiskers indicate 95% confidence interval (N=7 biological replicates from each strain). Statistical analysis of each myeloid population for each strain is shown in Fig. S7.

