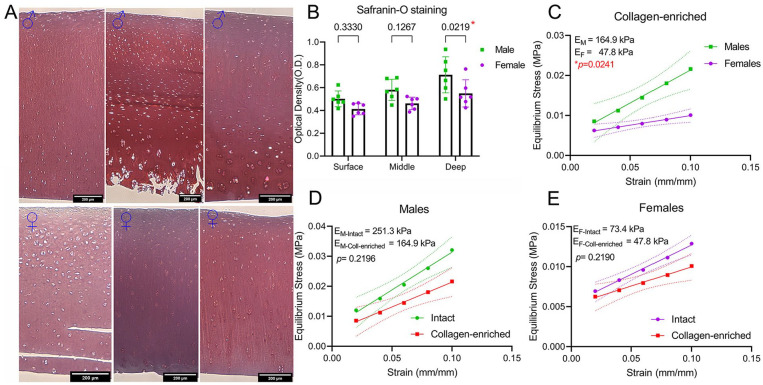
Figure 2.
Proteoglycans are not responsible for mechanical dimorphism. (A) Representative images of safranin-O staining of male and female cartilage. Fast green was omitted. Scale bars are 200 µm. (B) Quantification of optical density from safranin-O staining in surface, middle, and deep layers; n = 6♂ and 6♀, mean ± SD. (C) Stress-strain curve showing calculated equilibrium moduli for male and female tissue. Proteoglycans were digested with chondroitinase ABC. (D-E) Stress-strain slopes and equilibrium modulus of males and females comparing intact with proteoglycan-depleted cartilage. Data in C-E are presented as mean ± 95% CI (dotted lines in C-E); n = 6♂ and 6♀, with each measured in duplicate.

