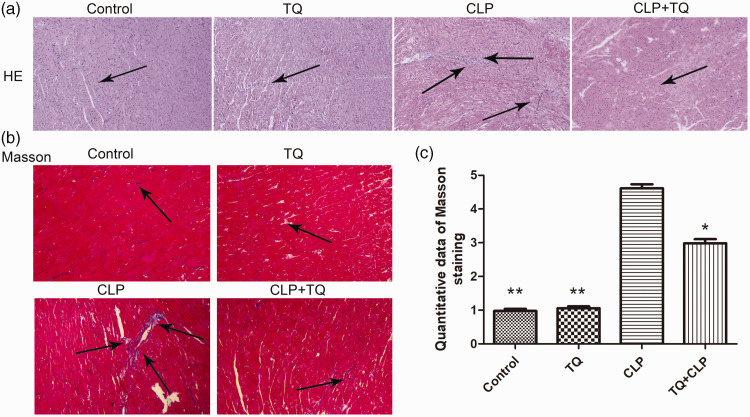
Figure 2.
(a) Representative H&E staining of cardiac tissue from BALB/c mice in the four groups after treatment. The arrows indicate damage. Magnification, ×40. (b) Representative images of Masson’s trichrome staining of cardiac tissue from BALB/c mice in the four groups after treatment. The arrows indicate damage. Magnification, ×40 and (c) Bar graph presenting the quantification of Masson’s trichrome-positive cells. Data are presented as the mean ± standard error of the mean (n = 3 per group). *P < 0.05 vs. CLP group, **P < 0.05 vs. CLP group.
CLP, cecal ligation and puncture; TQ, thymoquinone.

