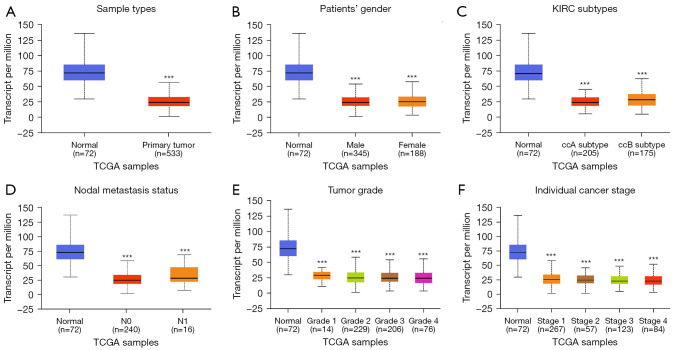
Figure 3.
ACSL4 mRNA expression levels in patients with ccRCC in TCGA dataset cohorts. (A) Plot chart showing the expression of ACSL4 in ccRCC tissues (n=533) compared with the normal controls (n=72). (B) Plots chart showing ACSL4 mRNA expression between male and female, (C) KIRC subtypes, (D) between the cases with or without nodal invasion, (E) the cases with different tumor grade and (F) clinical pathological stages. ***, P<0.001. ccRCC, clear cell renal cell carcinoma; TCGA, The Cancer Genome Atlas; KIRC, kidney renal clear cell carcinoma.

