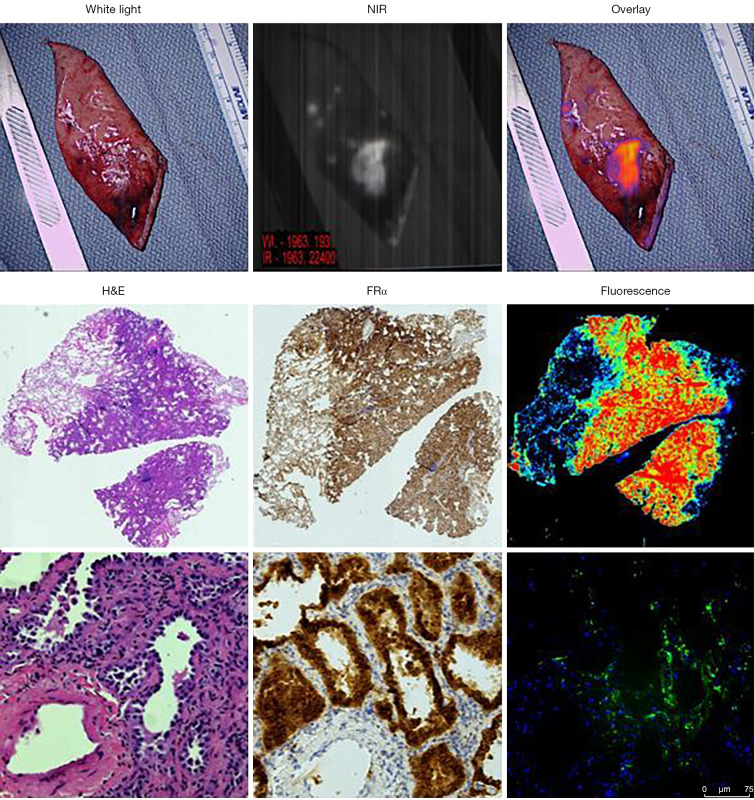
Figure 3.
Back table analysis of resected specimens confirms microscopic fluorescence in malignant cells expressing folate receptor alpha. This set of images show representative macroscopic and microscopic fluorescence of a patient enrolled in our study. The middle row shows macroscopic fluorescence images on the back table, showing clear delineation of the tumor by fluorescence. The bottom two rows shows microscopy slides of the tumor tissue stained with hematoxylin-eosin, immunohistochemistry analysis for folate receptor alpha, and correlation with microscopic fluorescence capturing DAPI stain (blue) and OTL38 (green). Top row of photos is original magnification, the middle row is 10× magnification. and the bottom row is 40× magnification. Scale bar shows 75 µm. NIR, near infrared.

