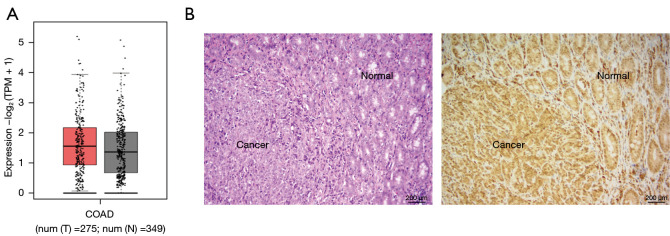
Figure 4.
The expression of Twist1 in tumor and normal tissues of colon cancer patients. (A) Analysis of the GEPIA data showed that the expression of Twist1 in tumor tissues was slightly higher than that in normal tissues, but there was no significant difference. (B) The expression of Twist l in normal and colon cancer tissues is showed by immunohistochemical staining. Scale bar =200 µm. TPM, transcripts per kilobase million; COAD, colon adenocarcinoma; T, tumour; N, normal; GEPIA, Gene Expression Profiling Interactive Analysis.

