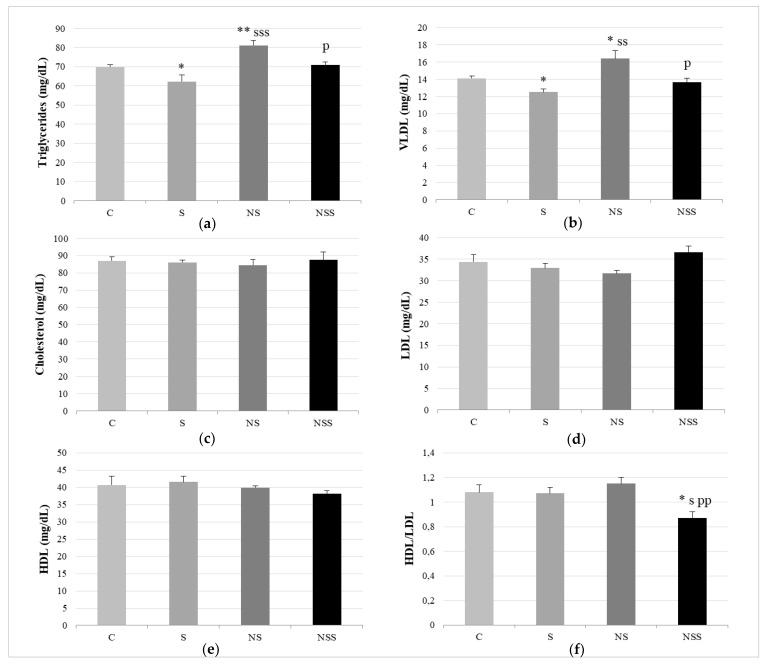
Figure 3.
Lipid profile. Triglycerides (a). VLDL (b). Cholesterol (c). LDL (d). HDL (e). HDL/LDL ratio (f). The results were expressed as means ± SEMs and analyzed using a multifactorial one-way ANOVA followed by Tukey’s test. The number of animals in each group was 6. SEM, standard error of the mean. Groups: C, control group; S, low-selenite group; NS, low-selenite-nanoparticle group; NSS, moderate-selenite-nanoparticle group. Significance: vs. C, * p < 0.05, ** p < 0.01; vs. S, s p < 0.05, ss p < 0.01, sss p < 0.001; vs. NP, p p < 0.05, pp p < 0.01.

