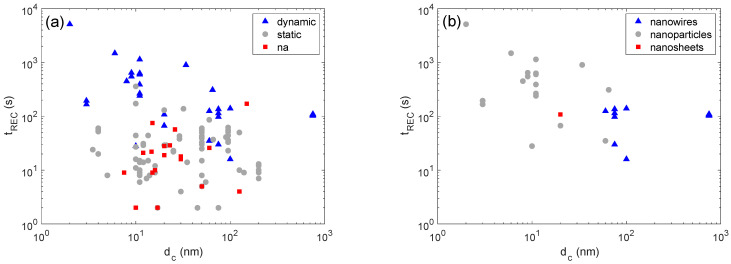
Figure 6.
Effects of crystallite size (dc) on recovery times (tREC). Plot showing the dependence of tREC on dc for the whole set of measurements; different colors identify different setups (a). Plot showing the dependence of tREC on dc for the set of measurements carried out with dynamic setups; different colors identify different crystallite shapes (b). In all plots, ‘na’ stands for ‘not available’—for those papers that did not provide enough detail to properly identify the class of the descriptive parameter.

