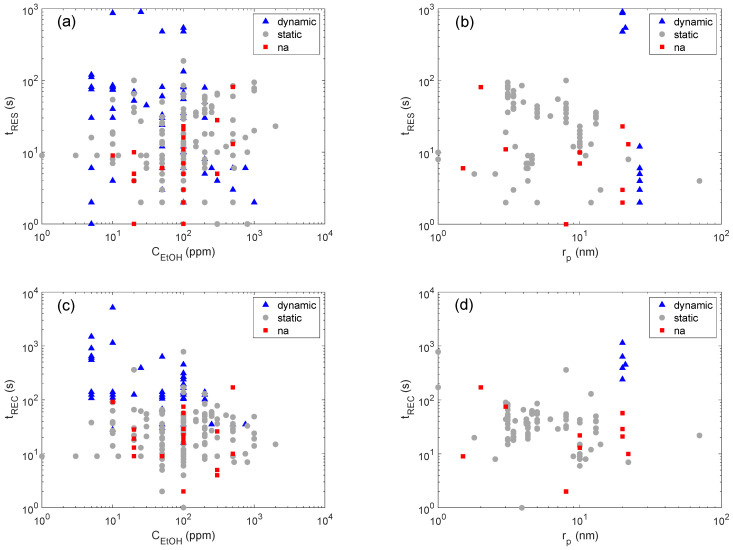
Figure A1.
Ethanol concentration (CEtOH), pore radius (rp) and measurement setup effects on the response (tRES) and recovery (tREC) times. Plots are tRES vs CEtOH (a), tRES vs rp (b), tREC vs CEtOH (c) and tREC vs rp (d). In all plots, colors are used to distinguish different measurement setups, and ‘na’ stands for ‘not available’.

