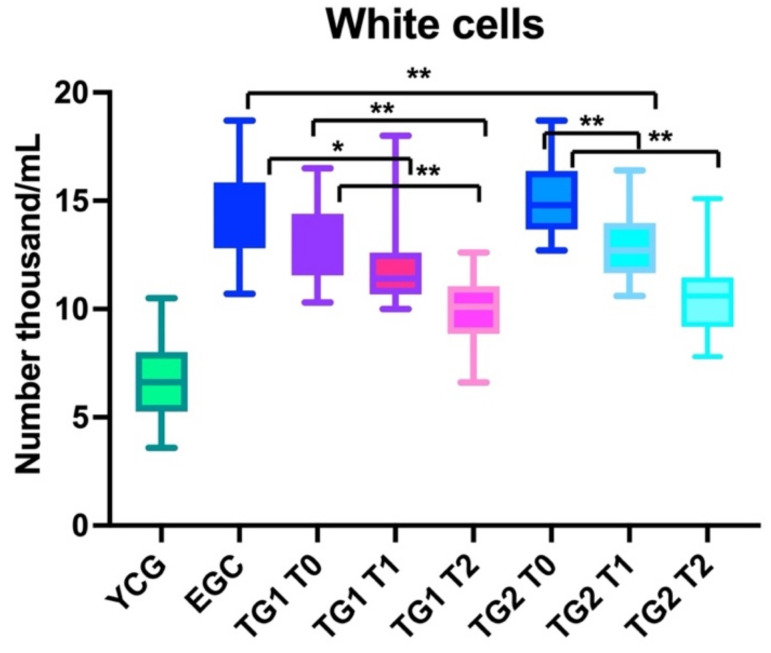
Figure 2.
The box graph shows the differences in term of lymphocytes number between young control group (YCG), elderly control group (ECG), treatment group 1 (TG1), and treatment group 2 (TG2); for TG1 and TG2, T1 and T2 were also described. YCG and ECG were always statistically significant different from TG1 and TG2 at T1 and T2. ** p < 0.01 * p <0.05.

