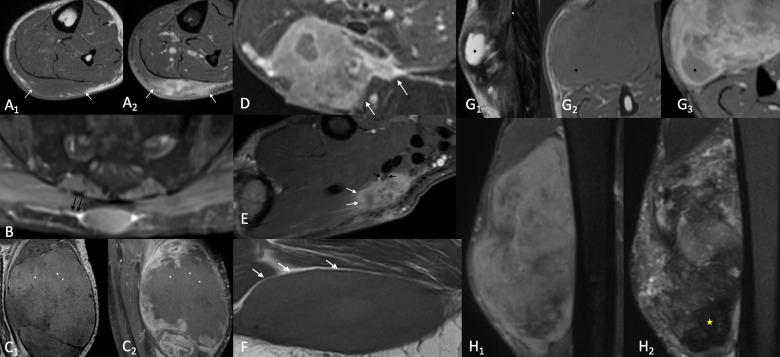
Figure 2.
Illustration of MRI features analysed by the two readers: A) Important tumoural enhancement (≥51% of tumour volume) on contrast enhanced FS T1 (A2) and diffuse growth pattern on both T1 (A1) and contrast enhanced FS T1 (A2) (arrows) B) Fascia tail sign (black arrows) on contrast enhanced FS T1. C) Tumoural haemorrhage: on T1 weighted images (C1) areas of hyperintense signal (asterisks) presenting no enhancement (asterisks) on contrast enhanced FS T1 (C2) D) Peritumoural enhancement (white arrows) on contrast enhanced FS T1 E) Diffuse growth pattern (arrows) and encasement of the thenar branch of the median nerve (black arrows) F) Peritumoural capsule fat sign (white arrows) G) Tumoural necrosis (asterisk): hyperintense signal on T2 (G1) hypointense signal on T1 (G2) and no enhancement on contrast enhanced FS T1 (G3). H) Highly heterogeneous lesion (more than 2/3 of the volume of the mass) on STIR (H1) presenting zones of hypointense signal on T2 (H2)

