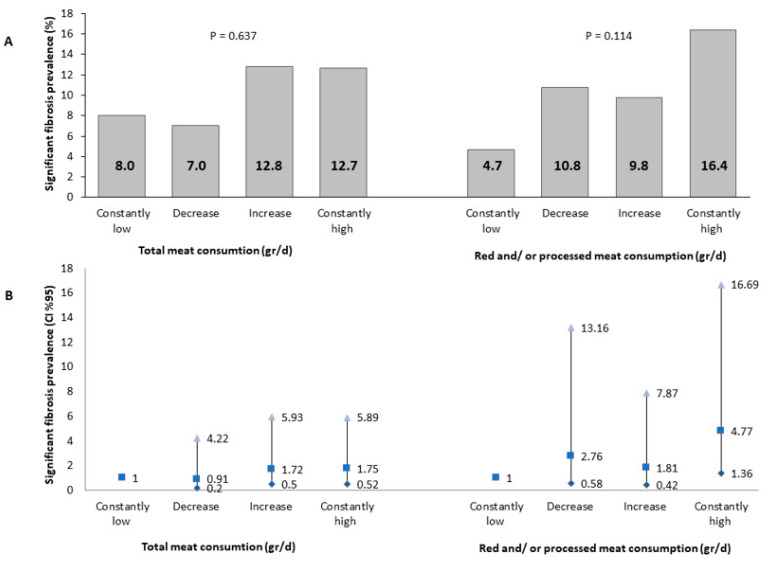
Figure 3.
Univariate (A) and multivariable (B) association between meat consumption and significant fibrosis (LSM ≥ 8.2 Kp). Abbreviations: CI, confidence interval. The multivariable analysis model is adjusted for baseline age (years), gender, BMI (Kg/m2), energy (Kcal), protein (% total Kcal), and cholesterol intake (mg/day). Consistent low consumption: consumption below the gender-specific medians at both the baseline and follow-up evaluations (N total in the category = 75/85 for total or red and/or processed meat, respectively). Decreased: consumption above the gender-specific median at the baseline survey and below the gender-specific median at the follow-up evaluation (N total in the category = 43/37 for total or red and/or processed meat, respectively). Increased: consumption below the gender-specific median at the baseline survey and above the gender-specific median at the follow-up evaluation (N total in the category = 47/41 for total or red and/or processed meat, respectively). Consistent high consumption: consumption above the gender-specific median at both the baseline and follow-up evaluations (N total in the category = 71/73 for total or red and/or processed meat, respectively). Abbreviations: CI, confidence interval; d, day.

