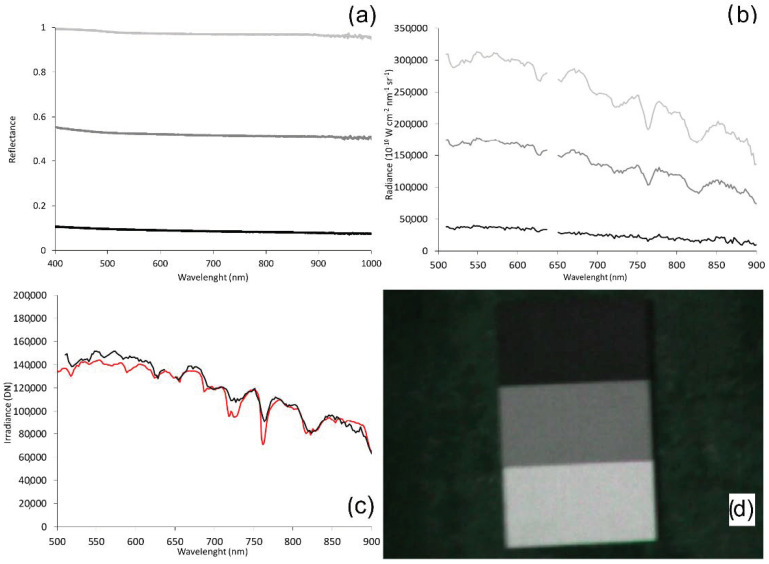
Figure 9.
(a) Reflectance spectral signature from 400 nm to 1000 nm of the control targets (OptoPolymer panels) obtained in the field with the spectroradiometer (GER); (b) Radiance spectral signature of the control targets (OptoPolymer panels) obtained in the field with Senop HSC-2; (c) Irradiance spectral signature (DN) comparison between GER spectroradiometer (red line) and Senop HSC-2 (black line); (d) OptoPolymer reference panels in the field. Reference panels legend: white panel @ 97% reflectance (light grey line), grey panel 56% reflectance (dark grey line), black panel @ 10% reflectance (black line).

