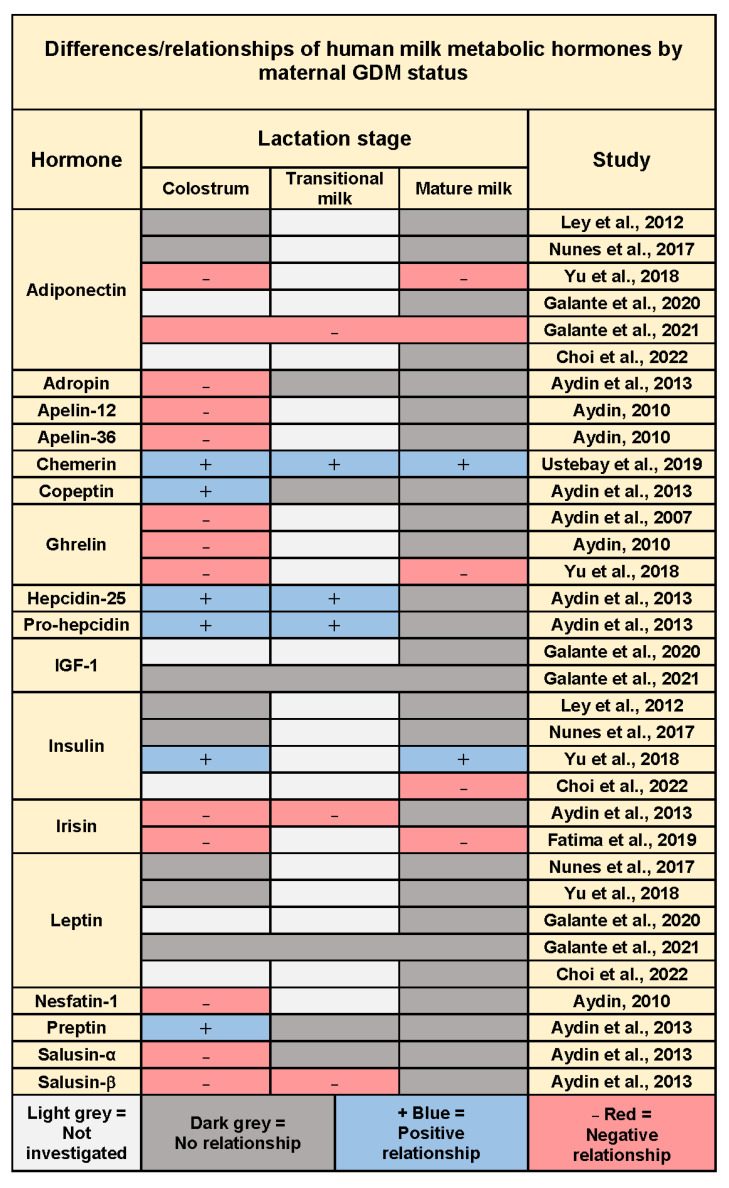
Figure 3.
Summary of results of quantitative synthesis across stages of lactation for studies investigating differences between GDM and control group and/or relationships between GDM and concentrations of human milk hormones at different lactation stages (p < 0.05). Galante et al., 2021 combined concentration results at all time points for analysis with no time effect reported.

