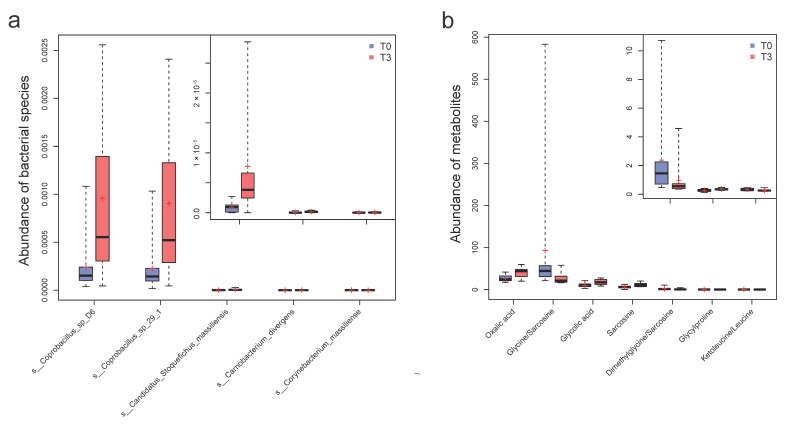
Figure 2.
The significantly varied species and metabolites accompanying probiotic supplementation. (a) The five differential species throughout the intervention (T3 vs. T0) identified by the Wilcoxon rank-sum test (p < 0.05) and Kruskal–Wallis test (p < 0.05), with the incorporation of T6 samples after probiotic discontinuity. (b) The seven differential metabolites (T3 vs. T0) identified by Wilcoxon rank-sum test (p < 0.05). Samples in the T3 group are shown in red, and samples in the T0 group are shown in blue.

