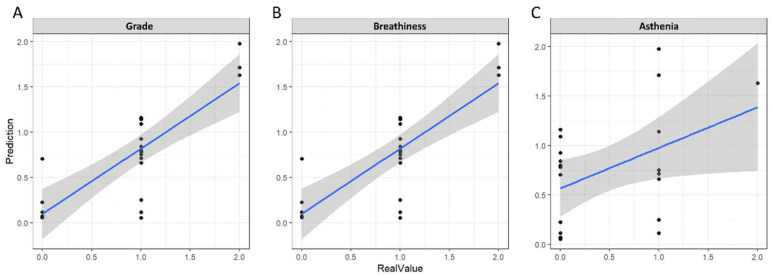
Figure 2.
The prediction results for the (A) grade, (B) breathiness, and (C) asthenia scores of the test set. The x-axis represents the observed GRBAS score of the patient, and the y-axis represents the predicted value by the deep learning model. The blue line is the regression line to see the relationship between the predicted value and the actual value.

