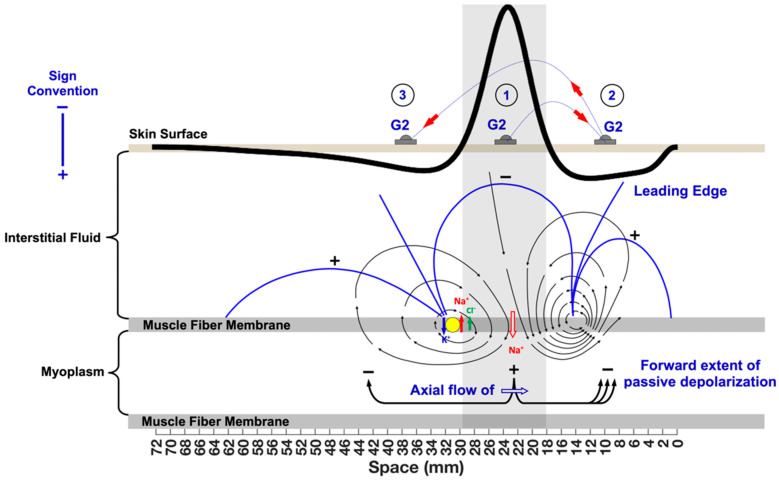
Figure 3.
The propagating components of the muscle fiber action potential (MFAP). The MFAP is depicted with its corresponding current lines (black lines going from the + pole to the − pole) and equipotential lines (blue lines surrounding each pole) originating from the dipole. The locations of G2 on the skin surface are: 1—over the depolarization zone; 2—the leading edge; and 3—the repolarization zone. The muscle fiber–tendon end-effect is circled and is represented by equipotential lines compressing at the muscle–tendon junction immediately above. This is an approximation since the actual action potential is better modeled as a double dipole (a tripole).

