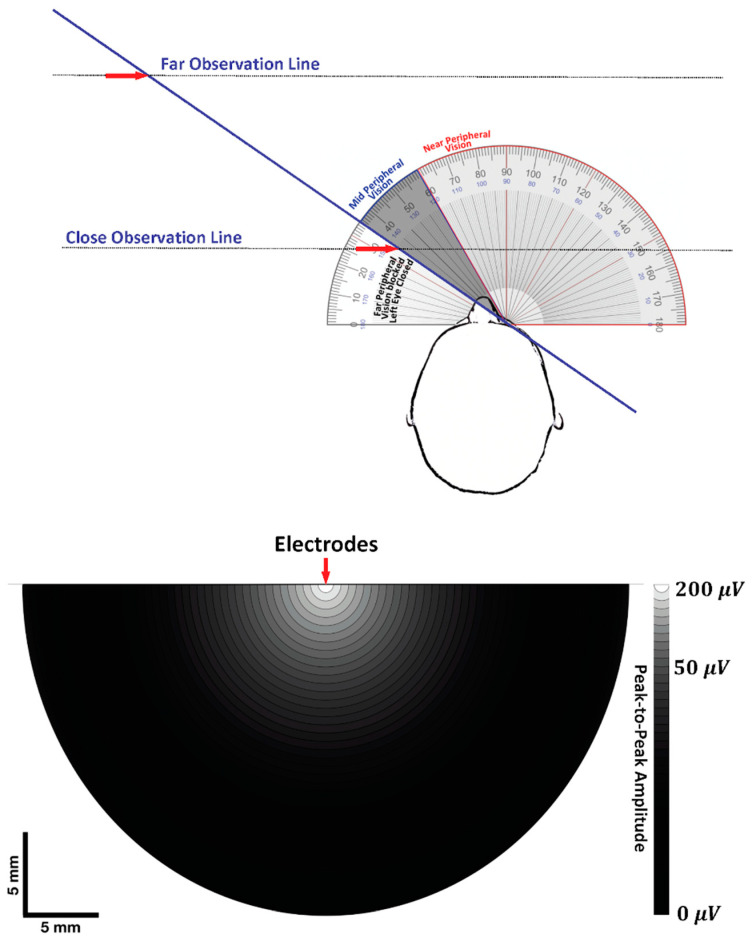
Figure 9.
A comparison between the visual field (top panel) and electrode pickup volume (bottom panel). The top panel shows the monocular visual field for the right eye, with the left eye shut. The horizontal black dotted lines indicate the geometry of object detection for near- versus far-visual fields of observation as an object moves from left-to-right mid- to near-peripheral vision and then center gaze. The red arrows denote the point at which the object is first detected at both observation distances. The bottom panel shows the pickup volume of bipolar electrodes with an interelectrode distance (IED) of 6 mm. The voltage gradient is mapped onto a cross-section of the muscle, normal to the fibers. The G1 electrode is behind G2, in parallel with the muscle fibers, at the origin of the voltage gradient. The voltage gradient is based on the peak-to-peak amplitude (VPP) of the motor unit action potentials (MUAPs) detected by surface electrodes that correspond to the depth at which that same MUAP was detected by a needle electrode. The greatest VPP is white on the greyscale voltage gradient, with darker shades indicating a progressive decrease with increasing distance away from the surface electrodes.

