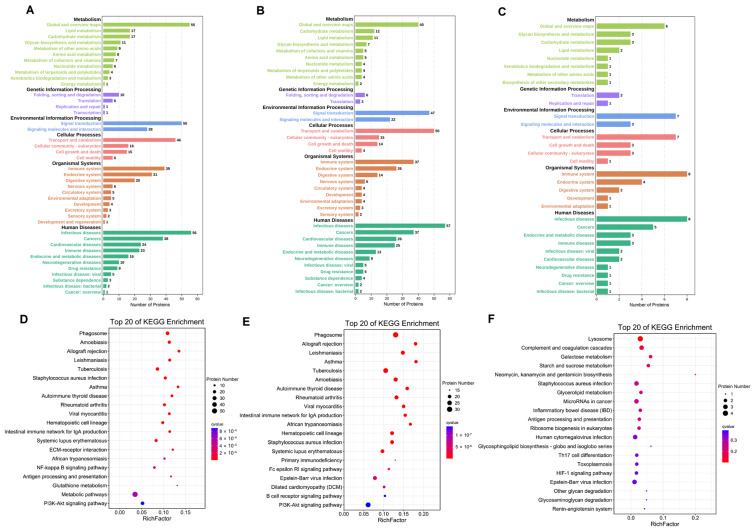
Figure 5.
Analysis of differentially expressed proteins in C vs. M (A), C vs. T (B), and M vs. T (C) in KEGG pathway. Top 20 of KEGG enrichment pathway in C vs. M (D), C vs. T (E), and M vs. T (F). The size of the dot represents the number of differential proteins annotated to the pathway. The color of the dot represents the size of the P value.

