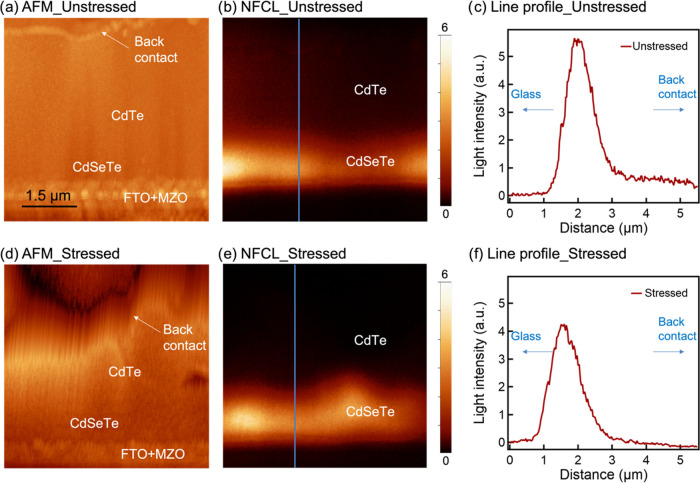
Figure 2.
Near-field cathodoluminescence results. (a) atomic force microscopy (AFM) of the unstressed CdSeTe/CdTe device; (b) NF-CL mapping of the unstressed CdSeTe/CdTe device; (c) light intensity profile of NF-CL marked in panel (b); (d) AFM of the stressed CdSeTe/CdTe device; (e) NF-CL mapping of the stressed CdSeTe/CdTe device; and (f) light intensity profile of NF-CL marked in panel (e). The AFM data is shown to help visualize where the NF-CL data is coming from. The luminescence intensity is plotted on a linear scale ranging from 0 to 6. The line profiles start from the glass side toward the back-contact side, as indicated by the arrows.

