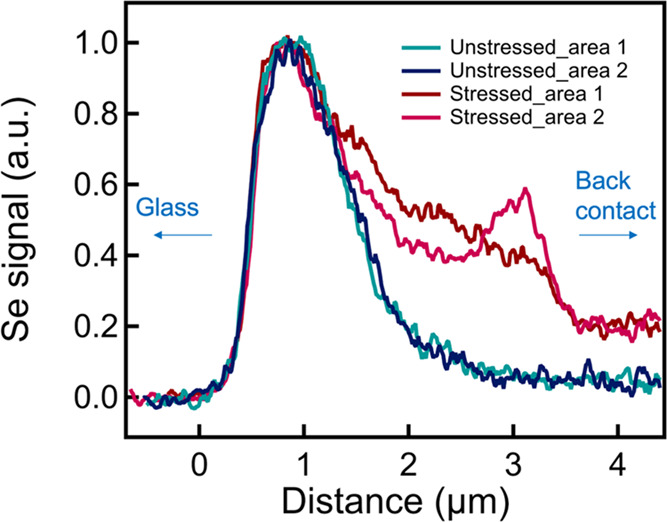
Figure 5.

Selenium line profiles on multiple locations of unstressed and stressed cells. We normalized the maximum Se signal to better compare its distribution. The line profiles start from the glass side toward the back-contact side, as indicated by the arrows.
