FIGURE 2.

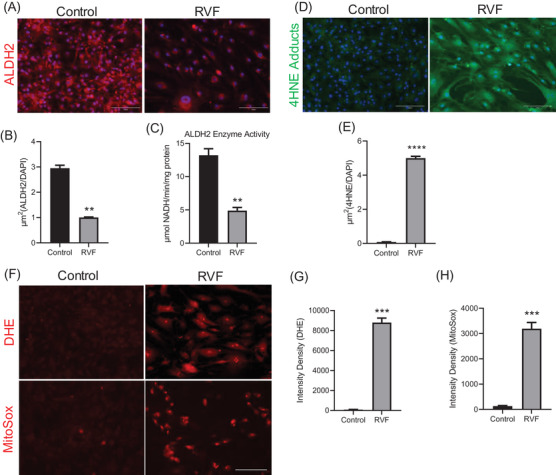
ALDH2 expression and activity in isolated RVF fibroblasts. (A) Immunofluorescence staining using ALDH2 antibody in RVF and control fibroblasts. Scale bar, 150 μm. (B) Plot displaying quantification of ALDH2 expression in the fibroblasts. (C) ALDH2 enzyme activity in proteins from the fibroblasts. (D) Immunofluorescence staining using anti‐4HNE adducts antibody in RVF and control fibroblasts. Scale bar, 150 μm. (E) Plot displaying quantification of 4HNE adducts expression in the fibroblasts. (F) Detection of superoxide by fluorescence in red channel by using Dihydroethidium or MitoSox™ Red in RVF and control fibroblasts. Scale bar, 150 μm. (G, H) Quantification of the fluorescent intensity density signal in Figure (F). Student's t‐test was used to analyse the data. Data are presented as mean ± SEM; n = 3, *p < .05 and **p < .01
