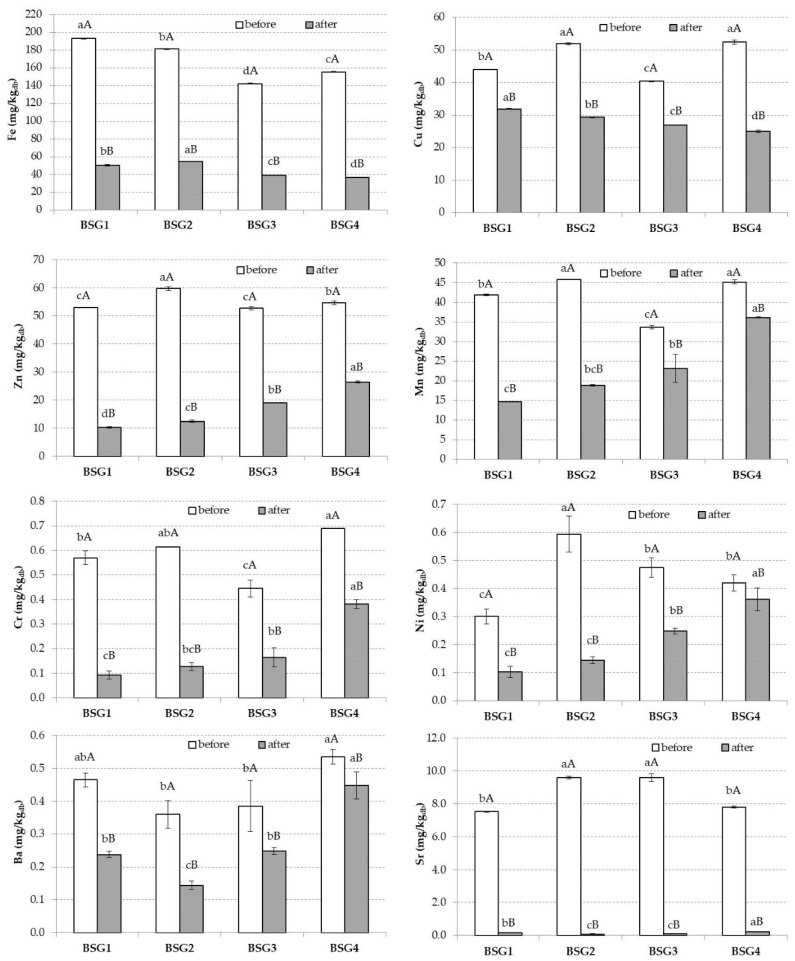
Figure 3.
Mean values and standard deviations (error bars) of the micro-mineral (Fe, Cu, Zn, Mn, Cr, Ni, Ba, and Sr) contents in four different brewers’ spent grain (BSG) samples. For each mineral, small letters indicate homogeneous groups established by the ANOVA (p < 0.05) by comparing BSGs before and after in vitro digestion. For each mineral, capital letters indicate homogeneous groups established by the ANOVA (p < 0.05) by comparing samples before and after in vitro digestion for each BSG sample. Note: db, dry weight.

