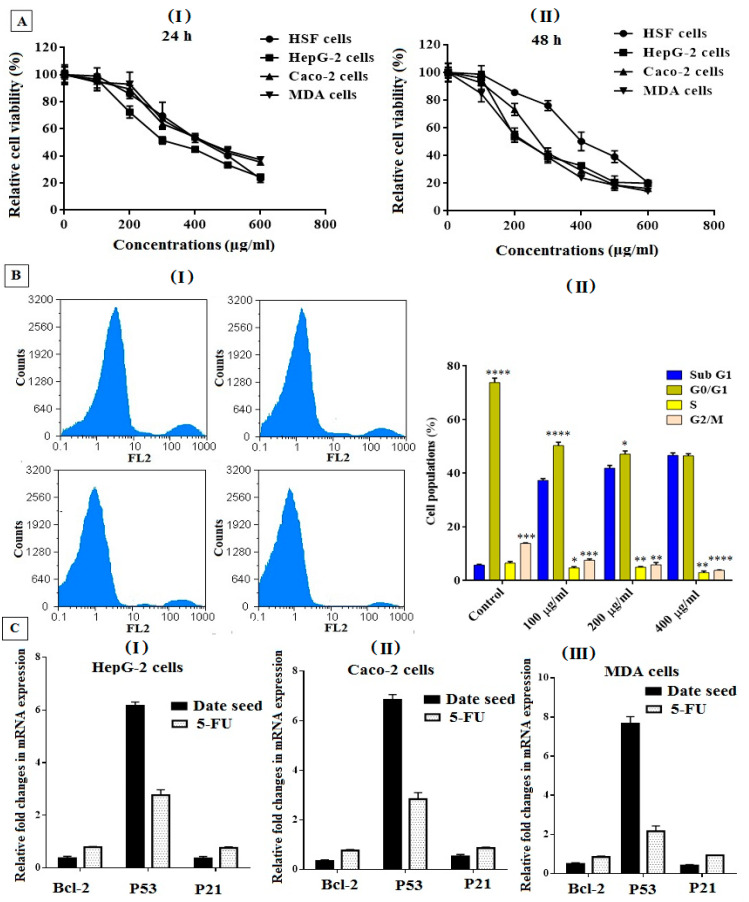
Figure 5.
(A) DSE effect on the viability of cancer (MDA, HepG-2, and Caco-2) and normal (HSF) cell lines using the MTT method. All cell lines were incubated with DSE at different concentrations (0–600 μg/mL) for 24 h (I) and 48 h (II). All values are expressed as mean ± SEM; n = 3. (B) Cell cycle distribution of DSE-treated HepG-2 cells at different doses for 48 h, (I) cell cycle distribution diagrams (original flow charts), and (II) quantitative distribution of the cells treated with DSE in different phases of the cell cycle compared with untreated (control) cells. All values are demonstrated as mean ± SEM, and differences were considered statistically significant at * p < 0.05, ** p < 0.005, *** p < 0.0005, and **** p < 0.0001. (C) Relative fold change in the gene expression of BCl2, P53, and p21 in the DSE treated cells using qPCR. Angiogenesis-related genes are evaluated in HepG-2 (I), Caco-2 (II), and MDA (III) cells before and after treatment with the DSE compared with 5-FU for 48 h. Values are presented as mean ± SEM.

